

依赖环境
操作系统:ubuntu 22.04
本文章所有软件基于docker docker-compose安装。安装方法文章不做介绍,请自行解决。
客户端安装
docker-compose.yml
version: '3.3'
services:
  ping_exporter:
    image: czerwonk/ping_exporter
    container_name: ping
    ports:
      - "9427:9427"
    volumes:
      - /data/ping:/config:ro
    restart: always
配置文件
文件路径:/data/ping/config.yml
targets:
  - 122.96.235.165
  - 117.147.213.41
  - 115.220.14.91

dns:
  refresh: 2m15s
  nameserver: 1.1.1.1

ping:
  interval: 2s
  timeout: 3s
  history-size: 42
  size: 120

options:
disableIPv6: false 122.96.235.165,117.147.213.41,115.220.14.91 为三网地址,如果你要修改,请同时修改监控面板对应的IP地址。
启动客户端
进入docker-compose.yml所在目录
docker-compose up -d设置防火墙
ufw allow from xxx.xxx.xxx.xxx to any port 9427
ufw reload
xxx.xxx.xxx.xxx 替换为你的服务端IP,允许服务端访问客户端的9427端口采集数据。
服务端安装
docker-compose.yml
version: '3.3'
services:
  openresty:
    image: openresty/openresty:latest
    container_name: openresty
    restart: always
    network_mode: host
    volumes:
      - /etc/localtime:/etc/localtime
      - /data/nginx/conf/nginx.conf:/usr/local/openresty/nginx/conf/nginx.conf:ro
      - /data/nginx/logs:/usr/local/openresty/nginx/logs
      - /data/nginx/cert:/usr/local/openresty/nginx/cert
      - /data/nginx/html:/usr/local/openresty/nginx/www:ro
      - /data/halo:/usr/local/openresty/nginx/html:ro
  prometheus:
    container_name: prometheus
    image: prom/prometheus:latest
    volumes:
      - /data/prometheus/prometheus.yml:/etc/prometheus/prometheus.yml
      - /data/prometheus/htpasswd.yml:/etc/prometheus/htpasswd.yml
      - /data/prometheus/data/:/prometheus
    ports:
      - '9090:9090'
    restart: always
    command:
      - '--config.file=/etc/prometheus/prometheus.yml'
      - '--web.config.file=/etc/prometheus/htpasswd.yml'
      - '--storage.tsdb.path=/prometheus'
      - '--web.console.libraries=/usr/share/prometheus/console_libraries'
      - '--web.console.templates=/usr/share/prometheus/consoles'
      - '--storage.tsdb.retention=30d'
      - '--web.enable-admin-api'
      - '--web.enable-lifecycle'
      - '--web.external-url=https://xxx.xxx.com/'
  grafana:
    container_name: grafana
    image: grafana/grafana:latest
    volumes:
      - /data/grafana/data:/var/lib/grafana
      - /data/grafana/conf/grafana.ini:/etc/grafana/grafana.ini
    ports:
      - '3000:3000'
    restart: always
    links:
- prometheus其中xxx.xxx.com 修改为自己的域名
--storage.tsdb.retention=30d 数据保留30天
--web.enable-admin-api 控制对admin HTTP API的访问,其中包括删除时间序列等功能 例子:curl -X POST -g 'http://localhost:9090/api/v1/admin/tsdb/delete_series?match[]={instance="xxx.xxx.xxx.xxx:9100"}'
--web.enable-lifecycle 支持热更新 例子:curl -X POST localhost:9090/-/reload 注意:在容器外修改yaml配置文件是徒劳的,因为容器外修改文件容器内是不会生效的,具体原因就不讲了,感兴趣的同学可以自行搜索了解。所以在容器外修改配置文件只能restart容器。
创建挂载目录
cd /data
mkdir -p prometheus grafana/data grafana/conf /nginx/conf
chmod a+rw grafana/data
cd /data/prometheus/
mkdir data
chmod a+rw data/
配置文件
nginx.conf
文件路径:/data/nginx/conf/nginx.conf
user daemon daemon;
worker_processes  auto;

error_log  logs/error.log  notice;

pid        logs/nginx.pid;

events {
    use epoll;
    worker_connections  1024;
}

http {
    include       mime.types;
    default_type  application/octet-stream;

    server_tokens off;

    server_names_hash_bucket_size 2048;
    server_names_hash_max_size 4096;

    log_format main '{ "@timestamp": "$time_local", '
    '"@fields": { '
    '"uri":"$request_uri",'
    '"url":"$uri",'
    '"upstream_addr":"$upstream_addr",'
    '"remote_addr": "$remote_addr", '
    '"remote_user": "$remote_user", '
    '"body_bytes_sent": "$body_bytes_sent", '
    '"host":"$host",'
    '"server_addr":"$server_addr",'
    '"request_time": "$request_time", '
    '"request_time":"$request_time",'
    '"status":"$status",'
    '"request": "$request", '
    '"request_method": "$request_method", '
    '"size":$body_bytes_sent,'
    '"upstream_time":"$upstream_response_time"'
    '"http_referrer": "$http_referer", '
    '"body_bytes_sent":"$body_bytes_sent", '
    '"http_x_forwarded_for": "$http_x_forwarded_for", '
    '"http_user_agent": "$http_user_agent" } }';

    #access_log  logs/access.log  main;
    access_log off;

    sendfile on;
    tcp_nopush on;
    keepalive_timeout 10;
    client_header_timeout 10s;
    client_body_timeout 10s;
    send_timeout 10s;
    fastcgi_buffer_size 512k;
    fastcgi_buffers 6 512k;
    fastcgi_busy_buffers_size 512k;
    fastcgi_temp_file_write_size 512k;
    connection_pool_size 256;
    client_header_buffer_size 32k;
    large_client_header_buffers 4 32k;
    request_pool_size 4k;
    output_buffers 4 32k;
    postpone_output 1460;
    client_max_body_size 1m;
    client_body_buffer_size 1024k;
    client_body_temp_path /usr/local/openresty/nginx/client_body_temp;
    proxy_temp_path /usr/local/openresty/nginx/proxy_temp;
    fastcgi_temp_path /usr/local/openresty/nginx/fastcgi_temp;
    fastcgi_intercept_errors on;
    tcp_nodelay on;

    proxy_headers_hash_max_size 51200;
    proxy_headers_hash_bucket_size 6400;

    proxy_buffering on;
    proxy_buffers 64 128k;

    gzip off;
    gzip_min_length 1k;
    gzip_buffers 4 8k;
    gzip_comp_level 5;
    gzip_http_version 1.1;
    gzip_types text/plain application/x-javascript text/css application/xml text/javascript image/jpeg image/gif image/png;

 server {
        listen       443 ssl;
        server_name  prometheus.xxx.com;

        access_log logs/prometheus.access.log main;
        error_log logs/prometheus.error.log  notice;

        ssl_certificate      /usr/local/openresty/nginx/cert/xxx.com.pem;
        ssl_certificate_key  /usr/local/openresty/nginx/cert/xxx.com.key;
        ssl_session_timeout  1d;
        ssl_session_cache shared:MozSSL:10m;
        ssl_session_tickets off;

        ssl_protocols TLSv1.2 TLSv1.3;
        ssl_ciphers 'TLS13-AES-256-GCM-SHA384:TLS13-CHACHA20-POLY1305-SHA256:TLS13-AES-128-GCM-SHA256:TLS13-AES-128-CCM-8-SHA256:TLS13-AES-128-CCM-SHA256:ECDHE-ECDSA-AES256-GCM-SHA384:ECDHE-RSA-AES256-GCM-SHA384:ECDHE-ECDSA-CHACHA20-POLY1305:ECDHE-RSA-CHACHA20-POLY1305:ECDHE-ECDSA-AES128-GCM-SHA256:ECDHE-RSA-AES128-GCM-SHA256:ECDHE-ECDSA-AES256-SHA384:ECDHE-RSA-AES256-SHA384:ECDHE-ECDSA-AES128-SHA256:ECDHE-RSA-AES128-SHA256';
        ssl_prefer_server_ciphers on;

        add_header Strict-Transport-Security "max-age=63072000" always;

        location / {
            proxy_set_header Host $host;
            proxy_pass http://127.0.0.1:9090/;
        }
    }

    server {
        listen 443 ssl;
        server_name grafana.xxx.com;

        access_log  logs/grafana.access.log  main;
        error_log   logs/grafana.error.log notice;

        ssl_certificate      /usr/local/openresty/nginx/cert/xxx.com.pem;
        ssl_certificate_key  /usr/local/openresty/nginx/cert/xxx.com.key;
        ssl_session_timeout  1d;
        ssl_session_cache shared:MozSSL:10m;
        ssl_session_tickets off;

        ssl_protocols TLSv1.2 TLSv1.3;
        ssl_ciphers 'TLS13-AES-256-GCM-SHA384:TLS13-CHACHA20-POLY1305-SHA256:TLS13-AES-128-GCM-SHA256:TLS13-AES-128-CCM-8-SHA256:TLS13-AES-128-CCM-SHA256:ECDHE-ECDSA-AES256-GCM-SHA384:ECDHE-RSA-AES256-GCM-SHA384:ECDHE-ECDSA-CHACHA20-POLY1305:ECDHE-RSA-CHACHA20-POLY1305:ECDHE-ECDSA-AES128-GCM-SHA256:ECDHE-RSA-AES128-GCM-SHA256:ECDHE-ECDSA-AES256-SHA384:ECDHE-RSA-AES256-SHA384:ECDHE-ECDSA-AES128-SHA256:ECDHE-RSA-AES128-SHA256';
        ssl_prefer_server_ciphers on;

        add_header Strict-Transport-Security "max-age=63072000" always;

        location / {
            add_header 'Access-Control-Allow-Origin' '*';
            proxy_pass http://127.0.0.1:3000/;
            proxy_set_header Upgrade $http_upgrade;
            proxy_set_header Connection "Upgrade";
            proxy_set_header Host $http_host;
            proxy_http_version 1.1;
        }
    }
}其中xxx.com 修改为你自己的域名,ssl所需证书请自行申请,域名解析自行完成。
证书存放路径:/data/nginx/cert
htpasswd.yml
文件路径:/data/prometheus/htpasswd.yml
basic_auth_users:
用户名: 加密密码用户名改成你自己的,加密密码通过以下方式生成并替换。
密码生成器
apt install apache2-utils
htpasswd -nBC 12 '' | tr -d ':\n'
#输入密码和确认密码,并将得到的加密后的密码,请牢记输入的密码
prometheus.yml
文件路径:/data/prometheus/prometheus.yml
global:
  scrape_interval:     60s
  evaluation_interval: 60s

scrape_configs:
  - job_name: "ping"
    static_configs:
      - targets: ['VPSIP1:9427']
        labels:
          name: 'VPS名称1'

      - targets: ['VPSIP2:9427']
        labels:
          name: 'VPS名称2'
grafana.ini
文件路径:/data/grafana/conf/grafana.ini
[paths]
[server]
[server.custom_response_headers]
[database]
[datasources]
[remote_cache]
[dataproxy]
[analytics]
[security]
[security.encryption]
[snapshots]
[dashboards]
[users]
default_theme = light
[secretscan]
[service_accounts]
[auth]
[auth.anonymous]
enabled = true
org_name = xxx.com
org_role = Viewer
[auth.github]
[auth.gitlab]
[auth.google]
[auth.grafana_com]
[auth.azuread]
[auth.okta]
[auth.generic_oauth]
[auth.basic]
[auth.proxy]
[auth.jwt]
[auth.ldap]
[aws]
[azure]
[rbac]
[smtp]
[smtp.static_headers]
[emails]
[log]
[log.console]
[log.file]
[log.syslog]
[log.frontend]
[quota]
[unified_alerting]
[unified_alerting.reserved_labels]
[unified_alerting.state_history]
[unified_alerting.state_history.external_labels]
[unified_alerting.state_history.annotations]
max_age =
max_annotations_to_keep =
[annotations]
[annotations.dashboard]
[annotations.api]
[explore]
[help]
[profile]
[news]
[query]
[query_history]
[metrics]
[metrics.environment_info]
[metrics.graphite]
[grafana_com]
[tracing.jaeger]
[tracing.opentelemetry]
[tracing.opentelemetry.jaeger]
[tracing.opentelemetry.otlp]
[external_image_storage]
[external_image_storage.s3]
[external_image_storage.webdav]
[external_image_storage.gcs]
[external_image_storage.azure_blob]
[external_image_storage.local]
[rendering]
[panels]
[plugins]
[live]
[plugin.grafana-image-renderer]
[support_bundles]
[enterprise]
[feature_toggles]
[date_formats]
[expressions]
[geomap]
[navigation.app_sections]
[navigation.app_standalone_pages]
[secure_socks_datasource_proxy]
[feature_management]
[public_dashboards]
其中
default_theme = light 主题颜色 这里为亮色
enabled = true 开启匿名访问
org_name = xxx.com 修改为你自己的域名,并且和后续grafana后台界面里设置一致
org_role = Viewer 匿名访问的角色 为只读
启动服务端
进入docker-compose.yml所在目录
docker-compose up -d设置防火墙
ufw allow 443/tcp
ufw reload
运行443端口被公网访问
初始化grafana
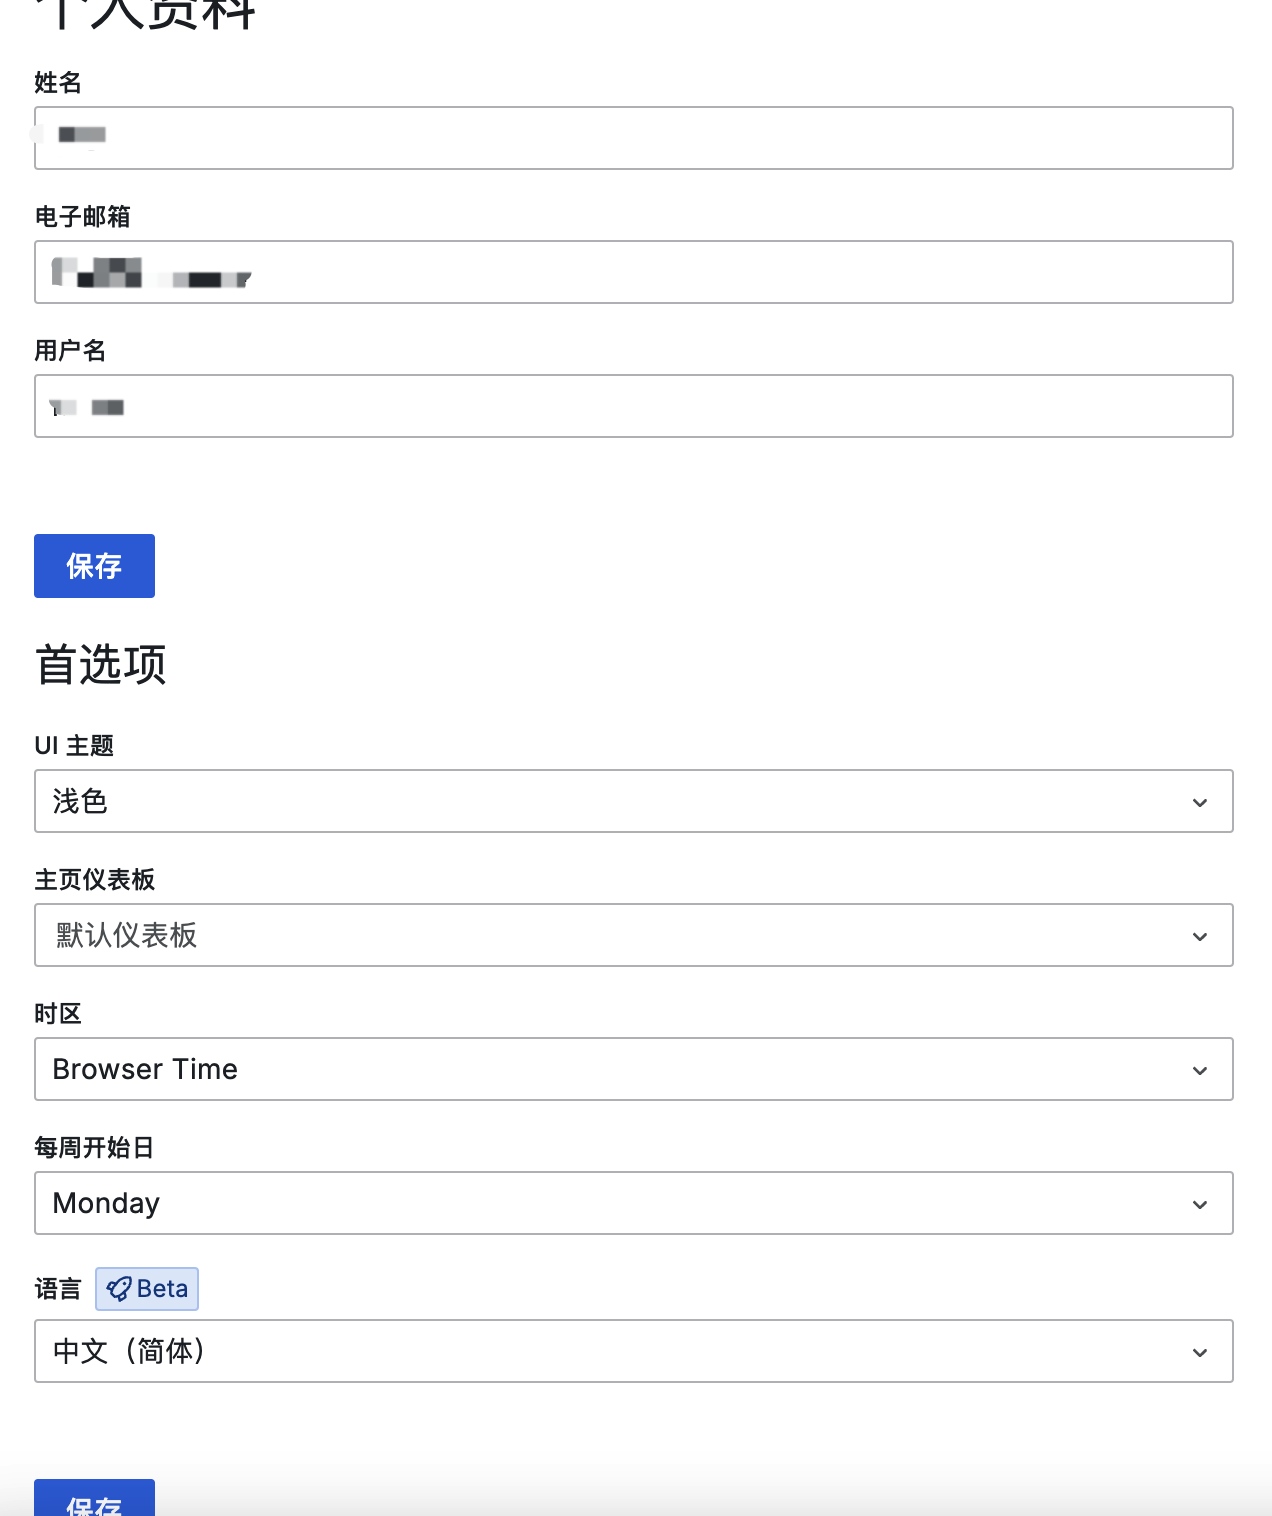
在浏览器访问https://grafana.xxx.com 在登录框输入用户名密码:admin/admin 登录后完成密码修改 完成后进入系统,点击右上角头像,选择Profile,完成用户名、名称、邮箱修改,下次你就可以用修改后的用户名或邮箱登录了。
查看prometheus
新建浏览器窗口访问:https://prometheus.xxx.com/ 输入htpasswd.yml配置文件中的用户名密码,进入系统。 点击菜单栏的Status,选择Targets  在界面看到UP表示健康指标正常采集,DOWN表示客户端连接失败
配置grafana
配置数据源
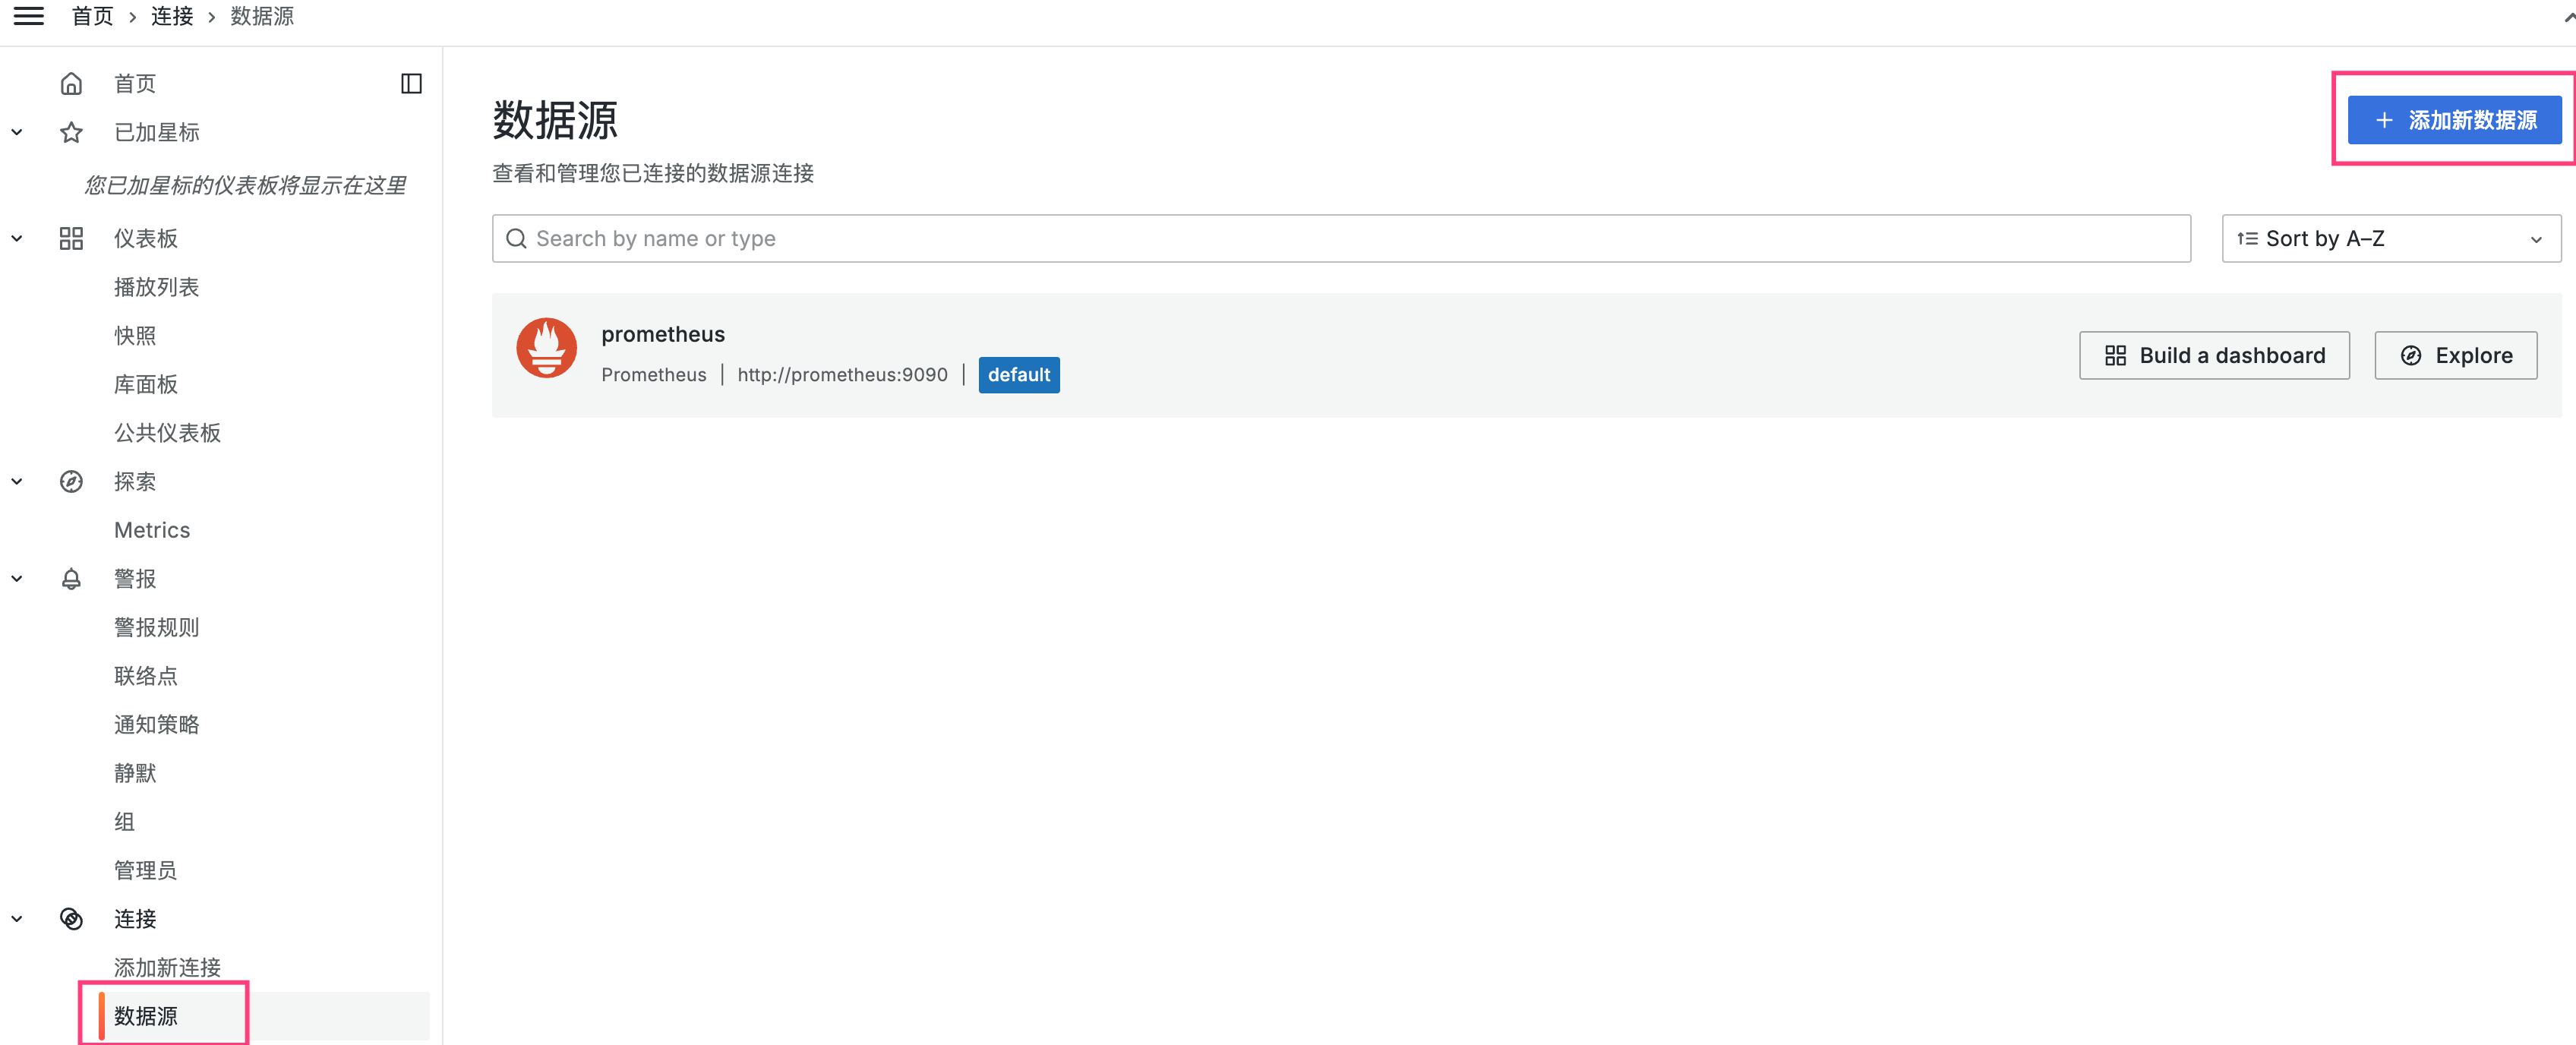
回到grafana 点击左侧菜单数据源,点击右上角添加新数据源
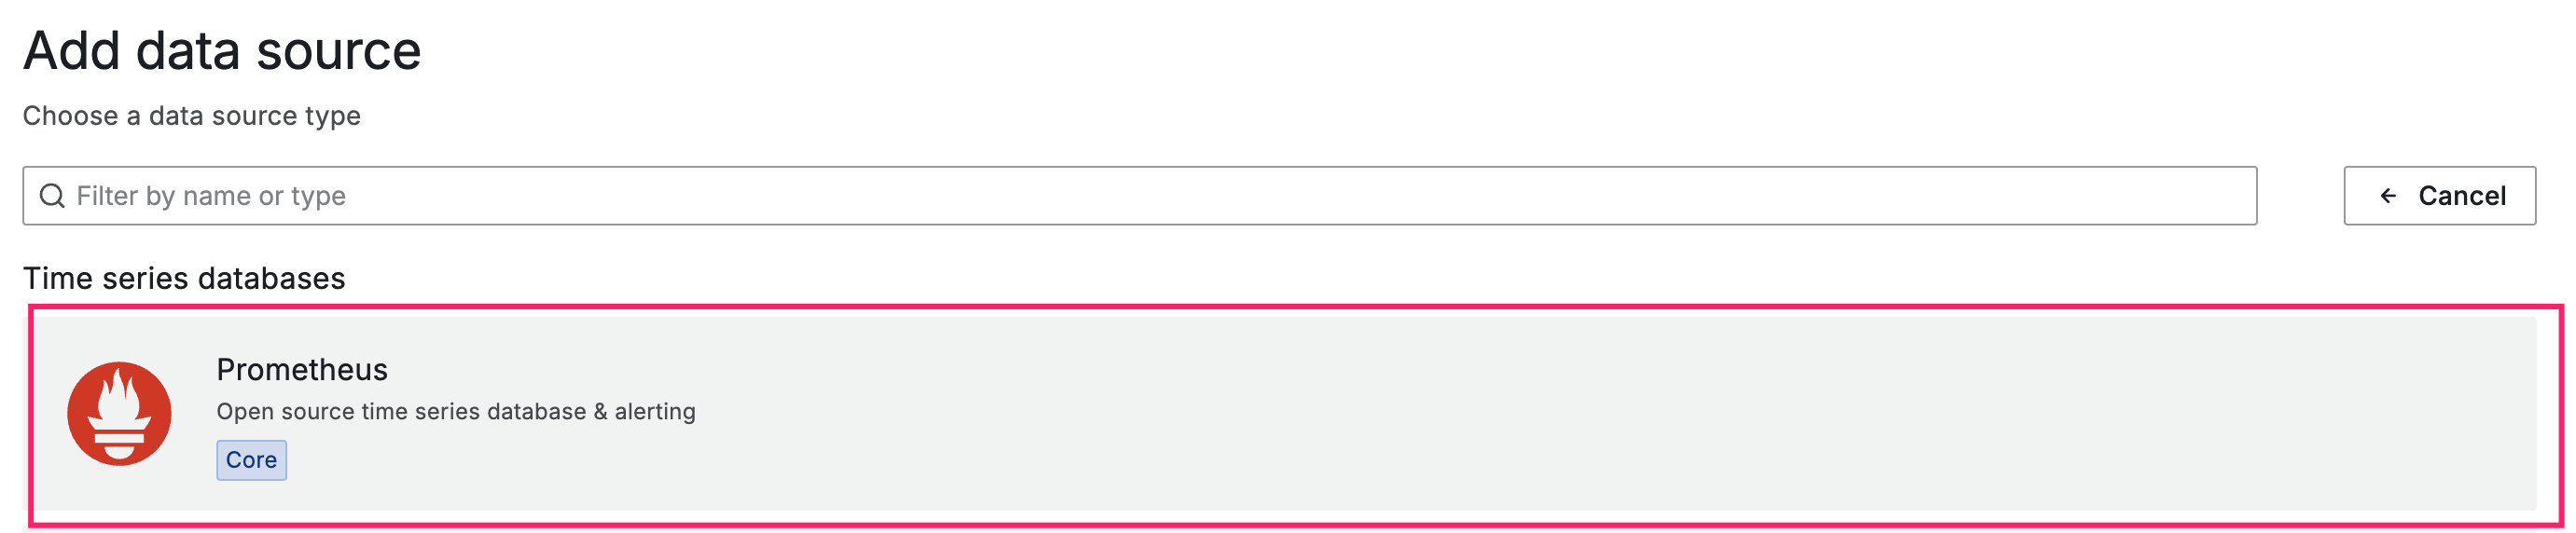
选择prometheus
输入以下内容,prometheus的IP端口,开启认证,prometheus配置的用户名密码。
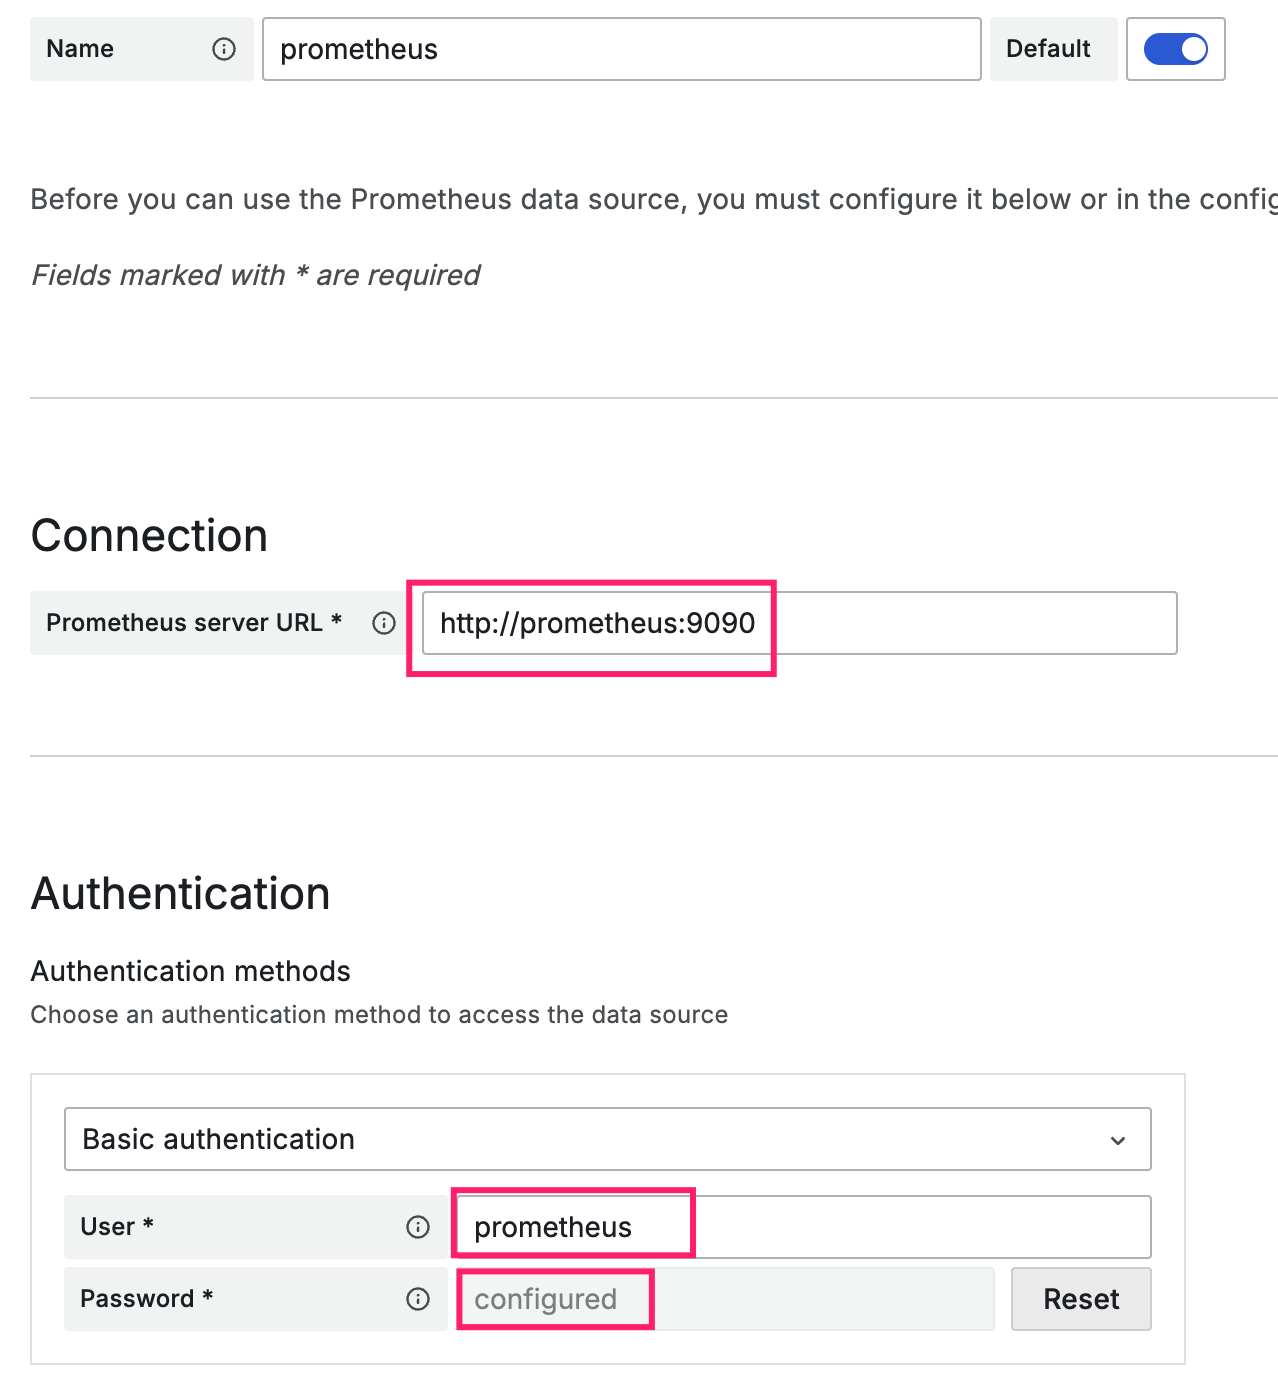
然后拉倒页面最底下,点击Save & Test,提示“Successfully queried the Prometheus API.”说明完成。
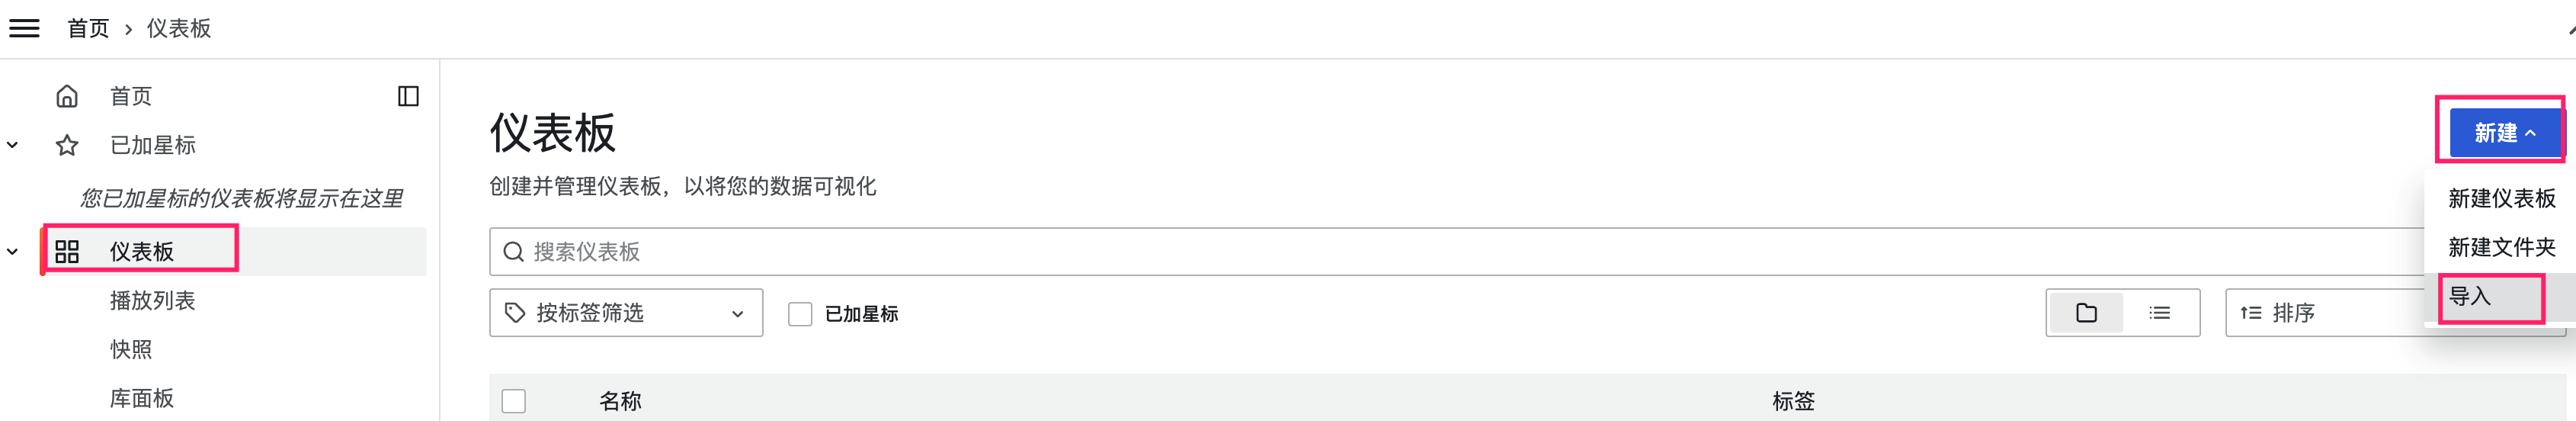
导入监控面板
点击左侧菜单仪表盘,点击右上角新建,点击导入
通过仪表板 JSON 模型导入
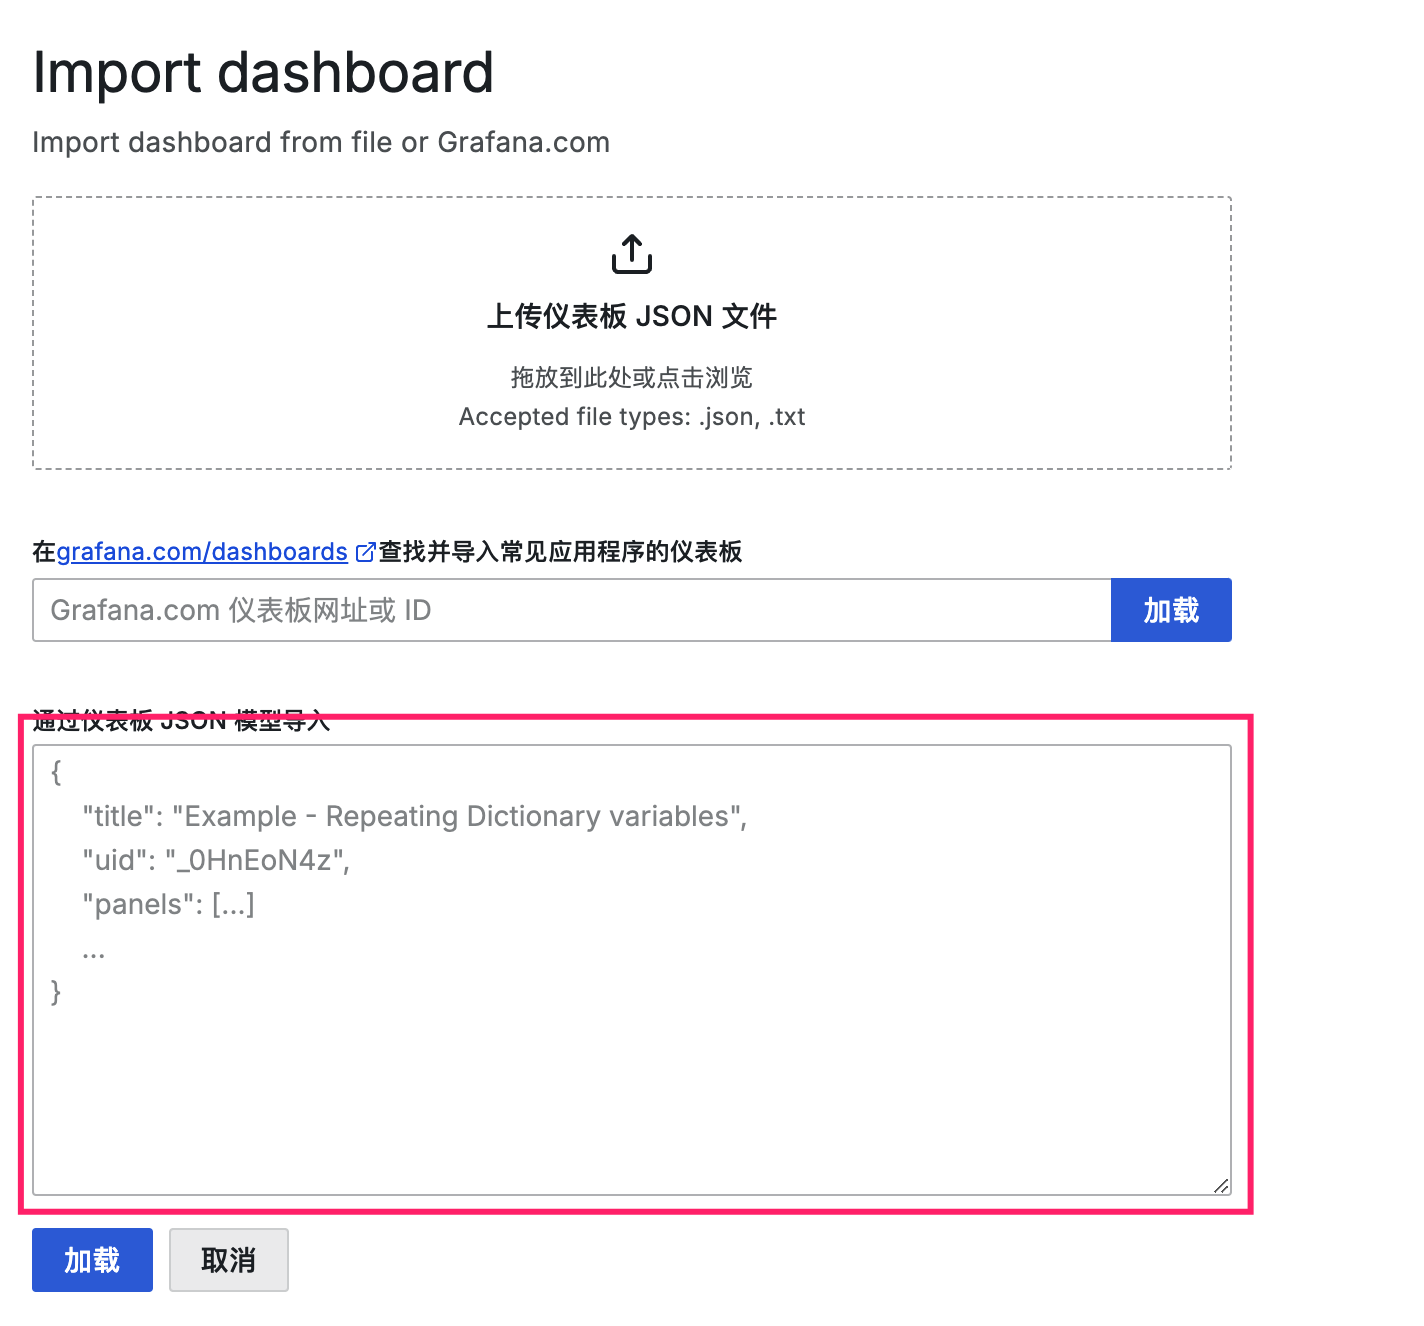
将以下内容复制到文本框中,加载。
{
"annotations": {
"list": [
{
"builtIn": 1,
"datasource": {
"type": "datasource",
"uid": "grafana"
},
"enable": true,
"hide": true,
"iconColor": "rgba(0, 211, 255, 1)",
"name": "Annotations & Alerts",
"target": {
"limit": 100,
"matchAny": false,
"tags": [],
"type": "dashboard"
},
"type": "dashboard"
}
]
},
"description": "",
"editable": true,
"fiscalYearStartMonth": 0,
"gnetId": 7587,
"graphTooltip": 0,
"id": 1,
"links": [],
"liveNow": false,
"panels": [
{
"collapsed": false,
"datasource": {
"type": "prometheus",
"uid": "Zjj3xYv4k"
},
"gridPos": {
"h": 1,
"w": 24,
"x": 0,
"y": 0
},
"id": 15,
"panels": [],
"repeat": "target",
"repeatDirection": "h",
"targets": [
{
"datasource": {
"type": "prometheus",
"uid": "Zjj3xYv4k"
},
"refId": "A"
}
],
"title": "$target",
"type": "row"
},
{
"datasource": {
"type": "prometheus",
"uid": "ddpm4nbs7abk0f"
},
"fieldConfig": {
"defaults": {
"color": {
"mode": "continuous-GrYlRd",
"seriesBy": "last"
},
"custom": {
"axisBorderShow": false,
"axisCenteredZero": false,
"axisColorMode": "text",
"axisLabel": "",
"axisPlacement": "auto",
"barAlignment": 0,
"drawStyle": "line",
"fillOpacity": 20,
"gradientMode": "scheme",
"hideFrom": {
"legend": false,
"tooltip": false,
"viz": false
},
"insertNulls": false,
"lineInterpolation": "smooth",
"lineStyle": {
"fill": "solid"
},
"lineWidth": 1,
"pointSize": 5,
"scaleDistribution": {
"type": "linear"
},
"showPoints": "auto",
"spanNulls": false,
"stacking": {
"group": "A",
"mode": "none"
},
"thresholdsStyle": {
"mode": "off"
}
},
"mappings": [],
"thresholds": {
"mode": "absolute",
"steps": [
{
"color": "green",
"value": null
},
{
"color": "red",
"value": 80
}
]
},
"unit": "s"
},
"overrides": []
},
"gridPos": {
"h": 10,
"w": 12,
"x": 0,
"y": 1
},
"id": 25,
"options": {
"legend": {
"calcs": [
"lastNotNull",
"logmin",
"max",
"stdDev"
],
"displayMode": "table",
"placement": "bottom",
"showLegend": true
},
"tooltip": {
"maxHeight": 600,
"mode": "multi",
"sort": "none"
}
},
"pluginVersion": "9.2.4",
"targets": [
{
"datasource": {
"type": "prometheus",
"uid": "cdjc4dwosc83kb"
},
"editorMode": "code",
"exemplar": false,
"expr": "ping_rtt_mean_seconds{name=~\"$target\",ip=\"122.96.235.165\"} >0",
"instant": false,
"interval": "$interval",
"legendFormat": "浙江联通",
"range": true,
"refId": "A"
},
{
"datasource": {
"type": "prometheus",
"uid": "ddpm4nbs7abk0f"
},
"editorMode": "code",
"expr": "ping_rtt_mean_seconds{name=~\"$target\",ip=\"117.147.213.41\"} >0",
"hide": false,
"instant": false,
"legendFormat": "浙江移动",
"range": true,
"refId": "B"
},
{
"datasource": {
"type": "prometheus",
"uid": "ddpm4nbs7abk0f"
},
"editorMode": "code",
"expr": "ping_rtt_mean_seconds{name=~\"$target\",ip=\"115.220.14.91\"} >0",
"hide": false,
"instant": false,
"interval": "",
"legendFormat": "浙江电信",
"range": true,
"refId": "C"
}
],
"title": "ICMP Mean",
"type": "timeseries"
},
{
"datasource": {
"type": "prometheus",
"uid": "ddpm4nbs7abk0f"
},
"fieldConfig": {
"defaults": {
"color": {
"mode": "palette-classic"
},
"custom": {
"axisBorderShow": false,
"axisCenteredZero": false,
"axisColorMode": "text",
"axisGridShow": true,
"axisLabel": "",
"axisPlacement": "auto",
"axisSoftMax": 0.5,
"barAlignment": 0,
"drawStyle": "line",
"fillOpacity": 0,
"gradientMode": "none",
"hideFrom": {
"legend": false,
"tooltip": false,
"viz": false
},
"insertNulls": false,
"lineInterpolation": "linear",
"lineWidth": 1,
"pointSize": 5,
"scaleDistribution": {
"type": "linear"
},
"showPoints": "auto",
"spanNulls": false,
"stacking": {
"group": "A",
"mode": "none"
},
"thresholdsStyle": {
"mode": "off"
}
},
"mappings": [],
"thresholds": {
"mode": "absolute",
"steps": [
{
"color": "green",
"value": null
},
{
"color": "red",
"value": 80
}
]
},
"unit": "percentunit"
},
"overrides": []
},
"gridPos": {
"h": 10,
"w": 12,
"x": 12,
"y": 1
},
"id": 17,
"options": {
"legend": {
"calcs": [
"lastNotNull",
"mean",
"max"
],
"displayMode": "table",
"placement": "bottom",
"showLegend": true
},
"tooltip": {
"maxHeight": 600,
"mode": "multi",
"sort": "none"
}
},
"pluginVersion": "9.2.4",
"targets": [
{
"datasource": {
"type": "prometheus",
"uid": "fWcy5_o4z"
},
"editorMode": "code",
"exemplar": false,
"expr": "ping_loss_ratio{name=~\"$target\",ip=\"122.96.235.165\"} < 1",
"format": "time_series",
"instant": false,
"interval": "$interval",
"intervalFactor": 1,
"legendFormat": "浙江联通",
"range": true,
"refId": "A"
},
{
"datasource": {
"type": "prometheus",
"uid": "ddpm4nbs7abk0f"
},
"editorMode": "code",
"expr": "ping_loss_ratio{name=~\"$target\",ip=\"117.147.213.41\"} < 1",
"hide": false,
"instant": false,
"interval": "$interval",
"legendFormat": "浙江移动",
"range": true,
"refId": "B"
},
{
"datasource": {
"type": "prometheus",
"uid": "ddpm4nbs7abk0f"
},
"editorMode": "code",
"expr": "ping_loss_ratio{name=~\"$target\",ip=\"115.220.14.91\"} < 1",
"hide": false,
"instant": false,
"interval": "$interval",
"legendFormat": "浙江电信",
"range": true,
"refId": "C"
}
],
"title": "Packet Loss Rate",
"type": "timeseries"
}
],
"refresh": "",
"schemaVersion": 39,
"tags": [
"prometheus",
"icmp",
"blackbox",
"ping_exporter"
],
"templating": {
"list": [
{
"auto": true,
"auto_count": 10,
"auto_min": "10s",
"current": {
"selected": false,
"text": "10s",
"value": "10s"
},
"hide": 0,
"label": "Interval",
"name": "interval",
"options": [
{
"selected": false,
"text": "auto",
"value": "$__auto_interval_interval"
},
{
"selected": false,
"text": "5s",
"value": "5s"
},
{
"selected": true,
"text": "10s",
"value": "10s"
},
{
"selected": false,
"text": "30s",
"value": "30s"
},
{
"selected": false,
"text": "1m",
"value": "1m"
},
{
"selected": false,
"text": "10m",
"value": "10m"
},
{
"selected": false,
"text": "30m",
"value": "30m"
},
{
"selected": false,
"text": "1h",
"value": "1h"
},
{
"selected": false,
"text": "6h",
"value": "6h"
},
{
"selected": false,
"text": "12h",
"value": "12h"
},
{
"selected": false,
"text": "1d",
"value": "1d"
},
{
"selected": false,
"text": "7d",
"value": "7d"
},
{
"selected": false,
"text": "14d",
"value": "14d"
},
{
"selected": false,
"text": "30d",
"value": "30d"
}
],
"query": "5s,10s,30s,1m,10m,30m,1h,6h,12h,1d,7d,14d,30d",
"queryValue": "",
"refresh": 2,
"skipUrlSync": false,
"type": "interval"
},
{
"allValue": "All = $__all",
"current": {
"selected": true,
"text": [
"All"
],
"value": [
"$__all"
]
},
"datasource": {
"type": "prometheus",
"uid": "ddpm4nbs7abk0f"
},
"definition": "query_result(ping_rtt_mean_seconds)",
"hide": 0,
"includeAll": true,
"multi": true,
"name": "target",
"options": [],
"query": {
"qryType": 3,
"query": "query_result(ping_rtt_mean_seconds)",
"refId": "PrometheusVariableQueryEditor-VariableQuery"
},
"refresh": 1,
"regex": "/.*name=\"(.*?)\".*/",
"skipUrlSync": false,
"sort": 5,
"type": "query"
}
]
},
"time": {
"from": "now-1h",
"to": "now"
},
"timeRangeUpdatedDuringEditOrView": false,
"timepicker": {
"refresh_intervals": [
"5s",
"10s",
"30s",
"1m",
"5m",
"15m",
"30m",
"1h",
"2h",
"1d"
],
"time_options": [
"5m",
"15m",
"1h",
"6h",
"12h",
"24h",
"2d",
"7d",
"30d"
]
},
"timezone": "",
"title": "xxxxx 探针",
"uid": "5iEFq2aIz",
"version": 33,
"weekStart": ""
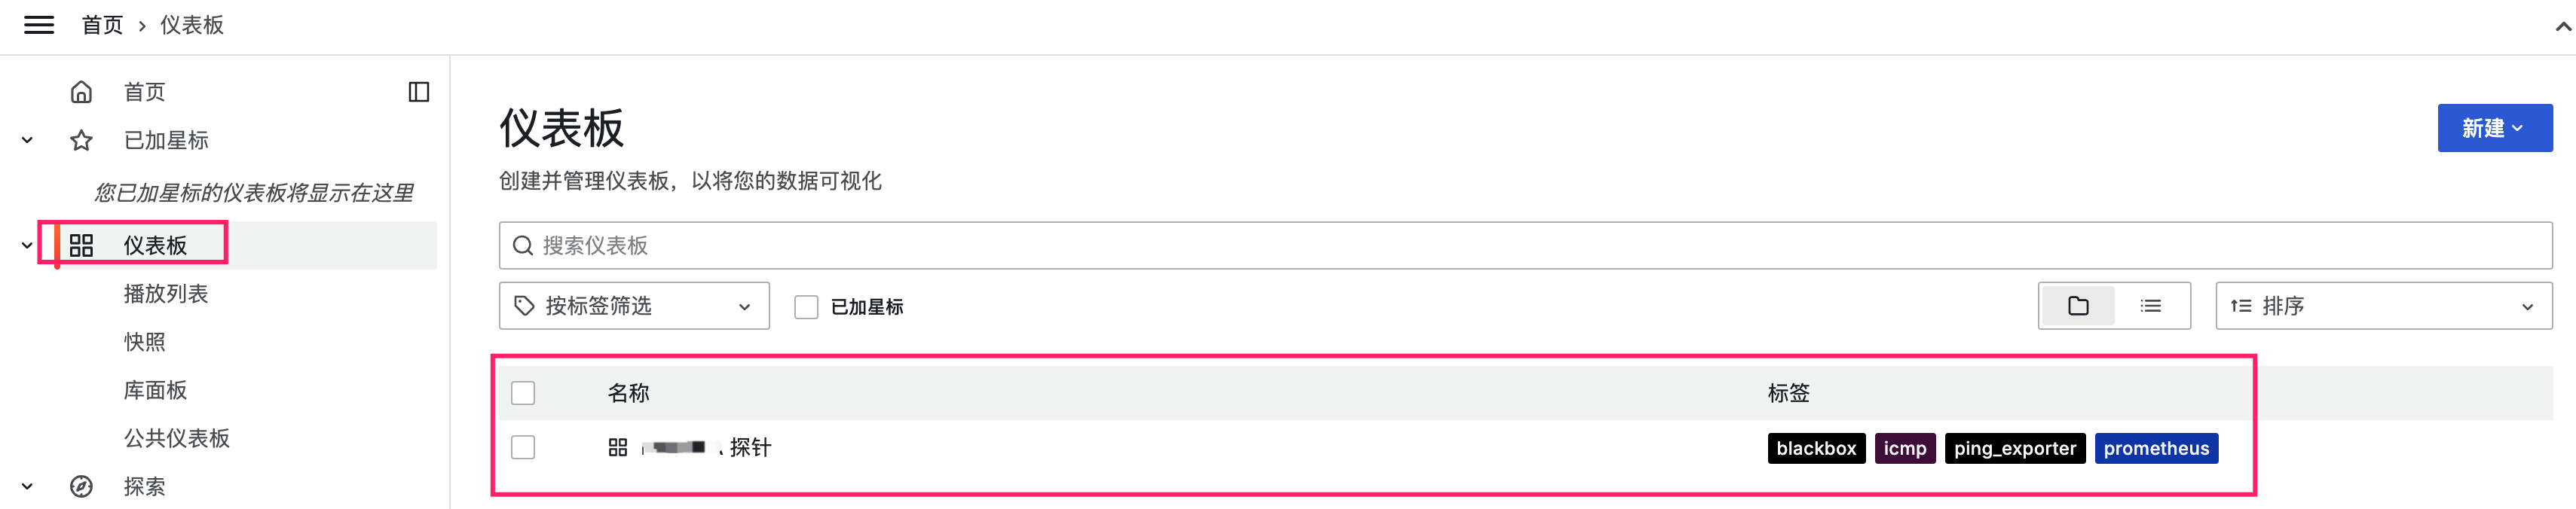
}配置监控面板
点击左侧菜单仪表盘,点击新建的监控面板。
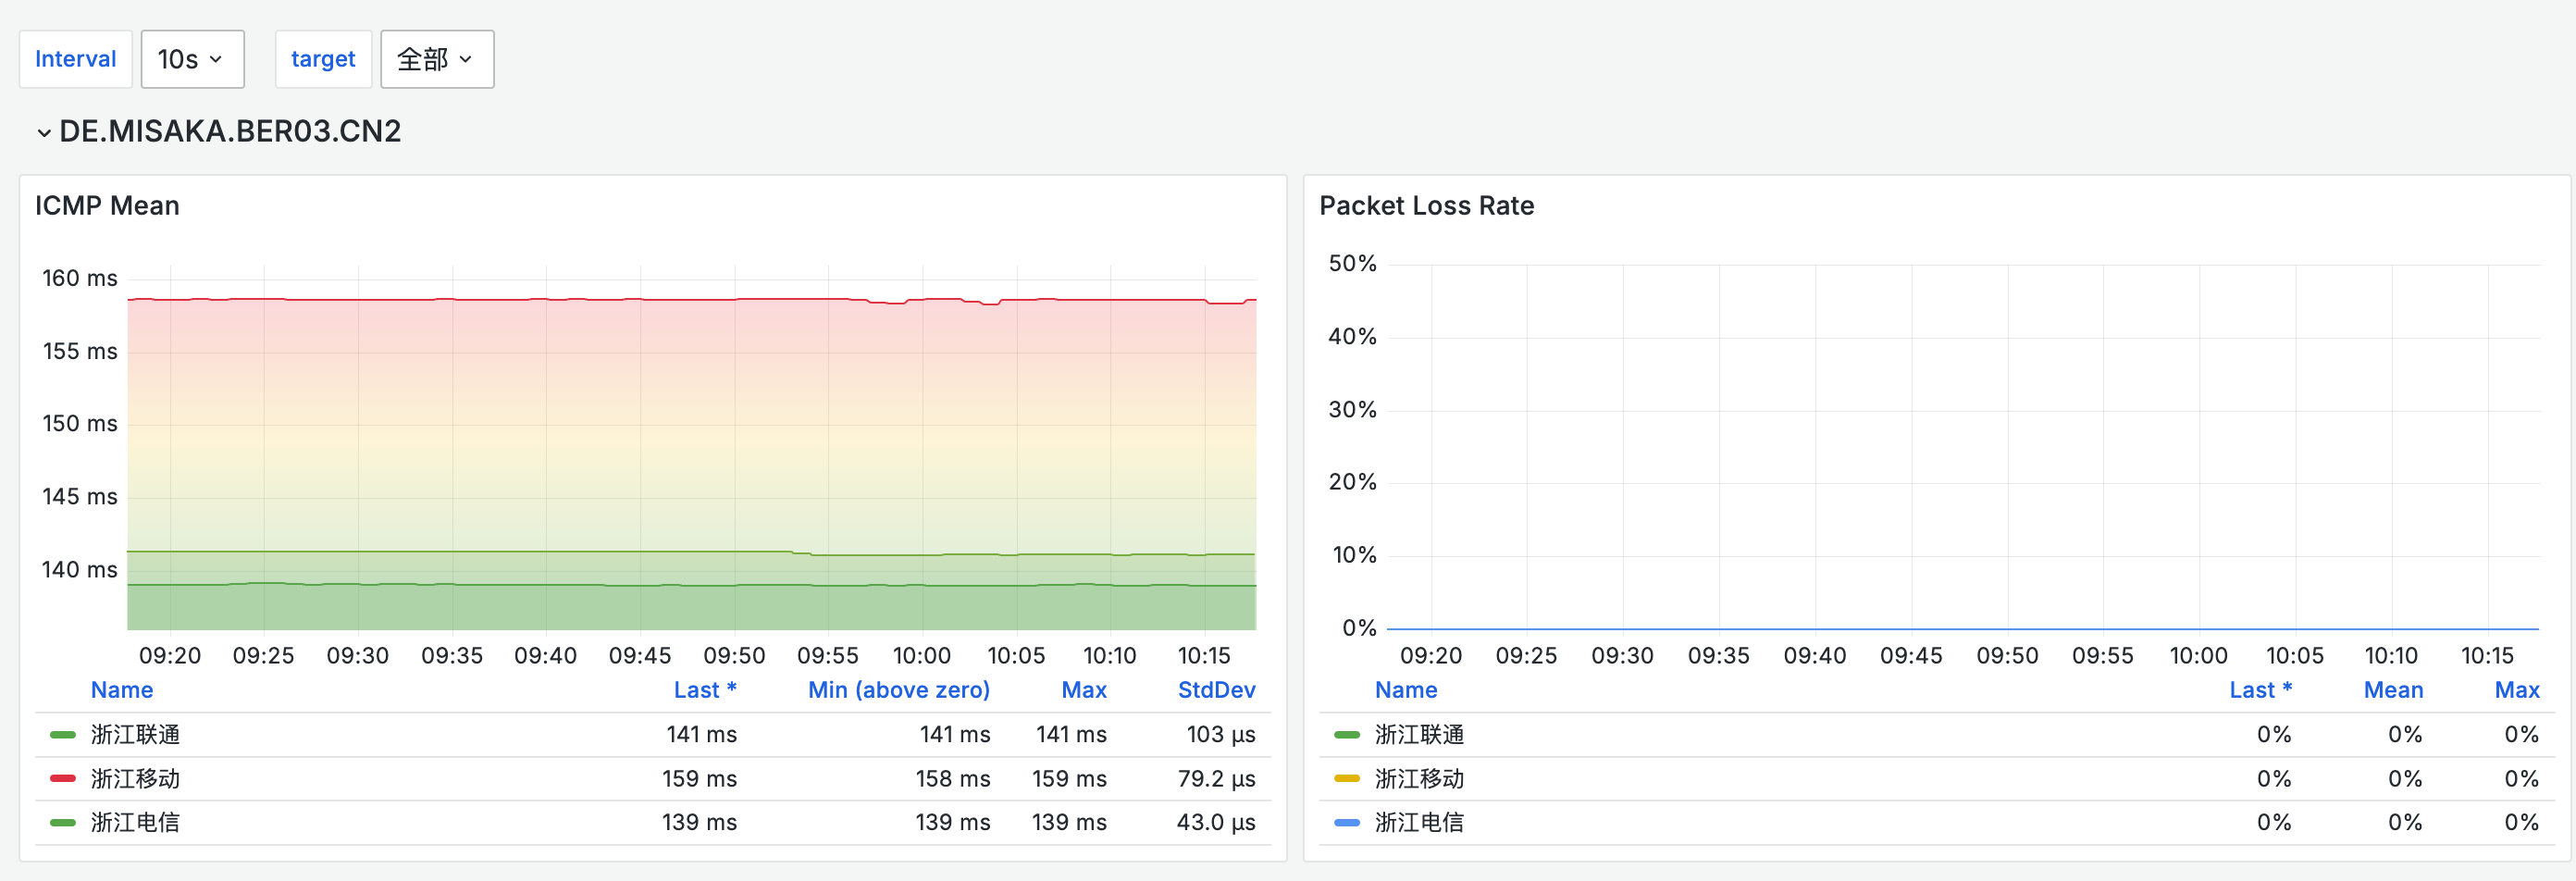
展示以下内容说明部署成功
点击仪表盘配置

点击变量,点击target变量
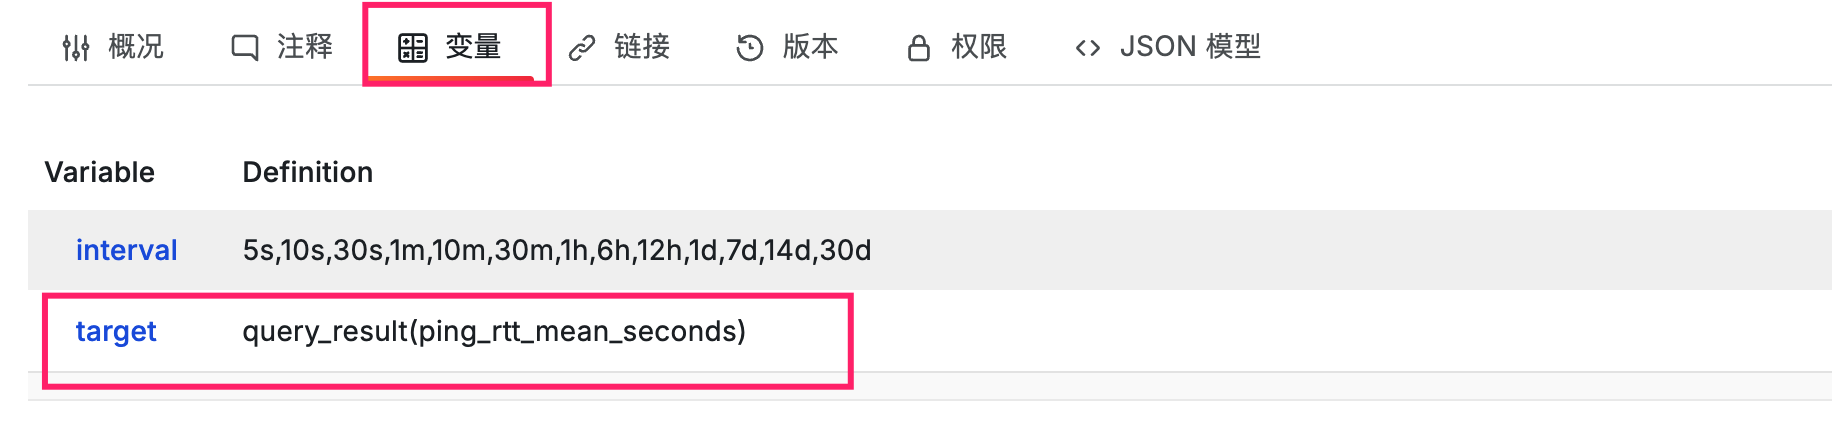
以下设置依次为
Query: 查询指标
Regex: 过滤条件,这里只查询含MISAKA关键字的name字段
Sort: 排序方式
Select option: 下拉菜单选项,设置了多选
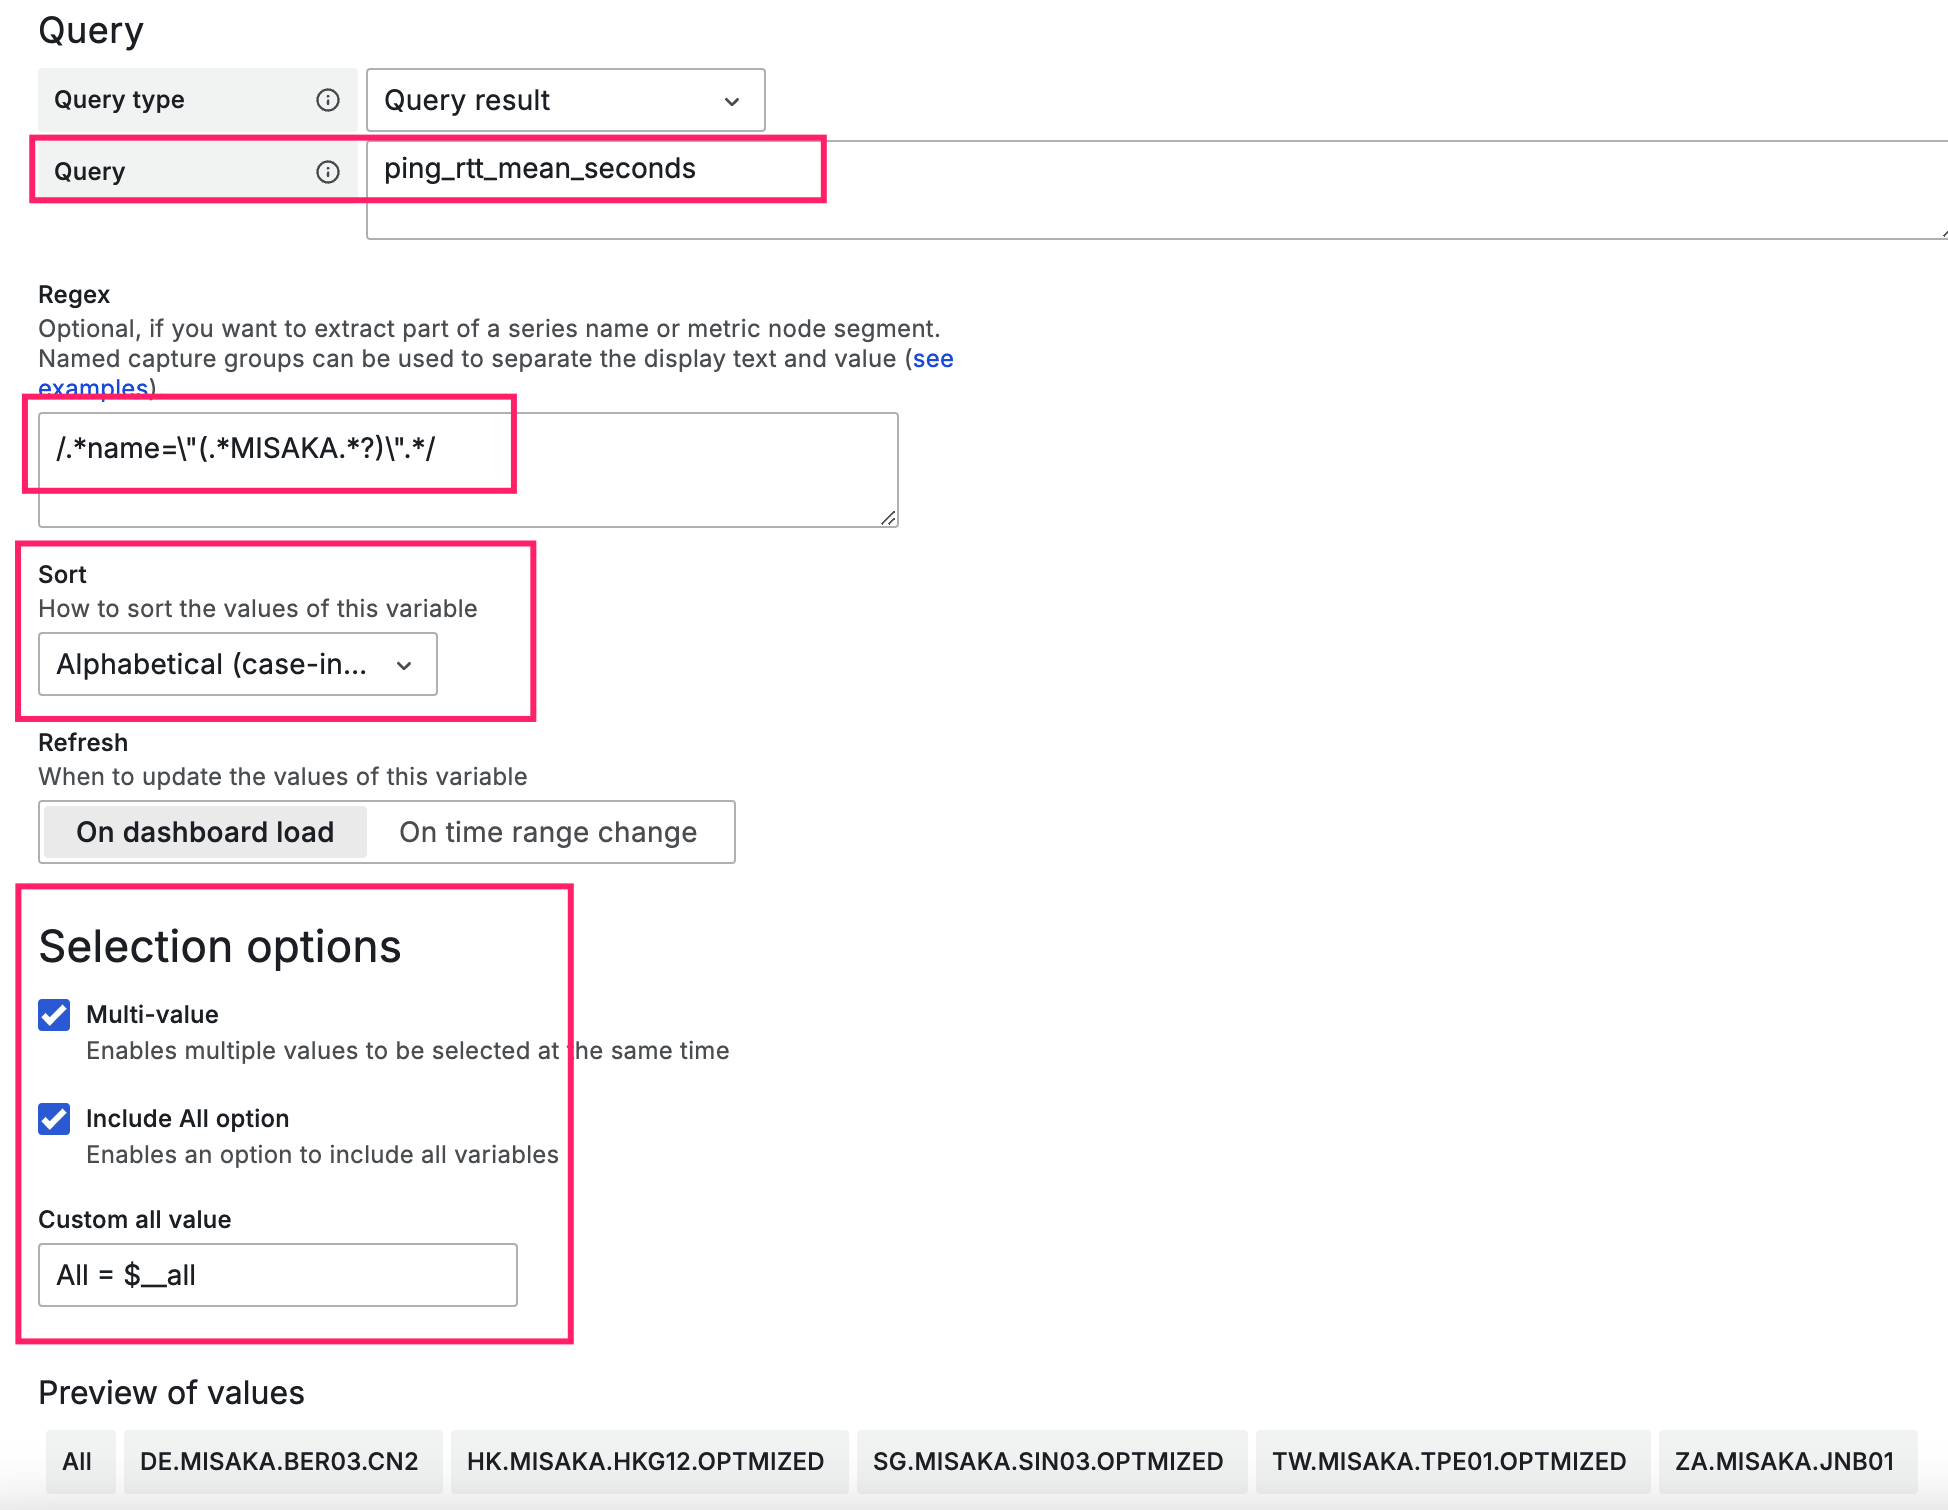
设置完成后,点击Save dashboard,Save as 是另存为 Close 不保存关闭

点击豆腐块右上角三点,点击编辑
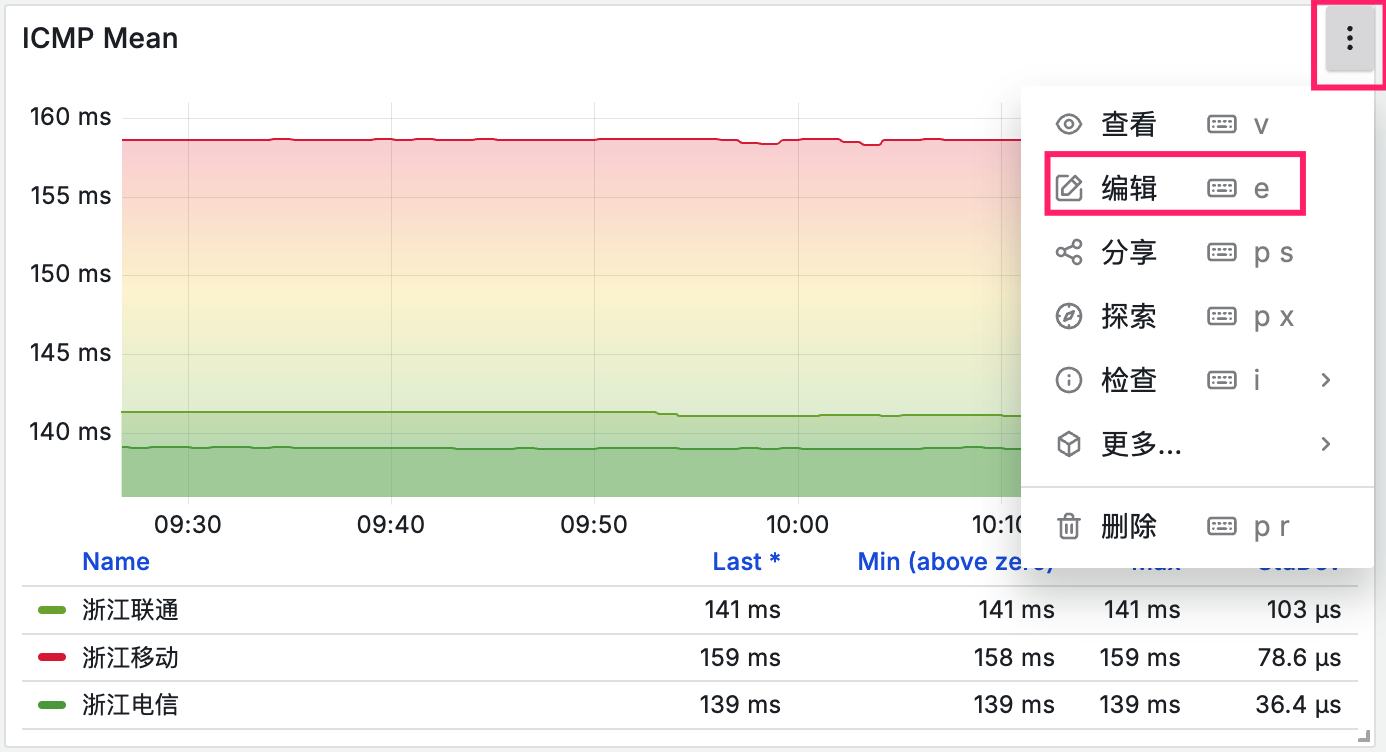
根据你的三网延迟IP修改相关设置
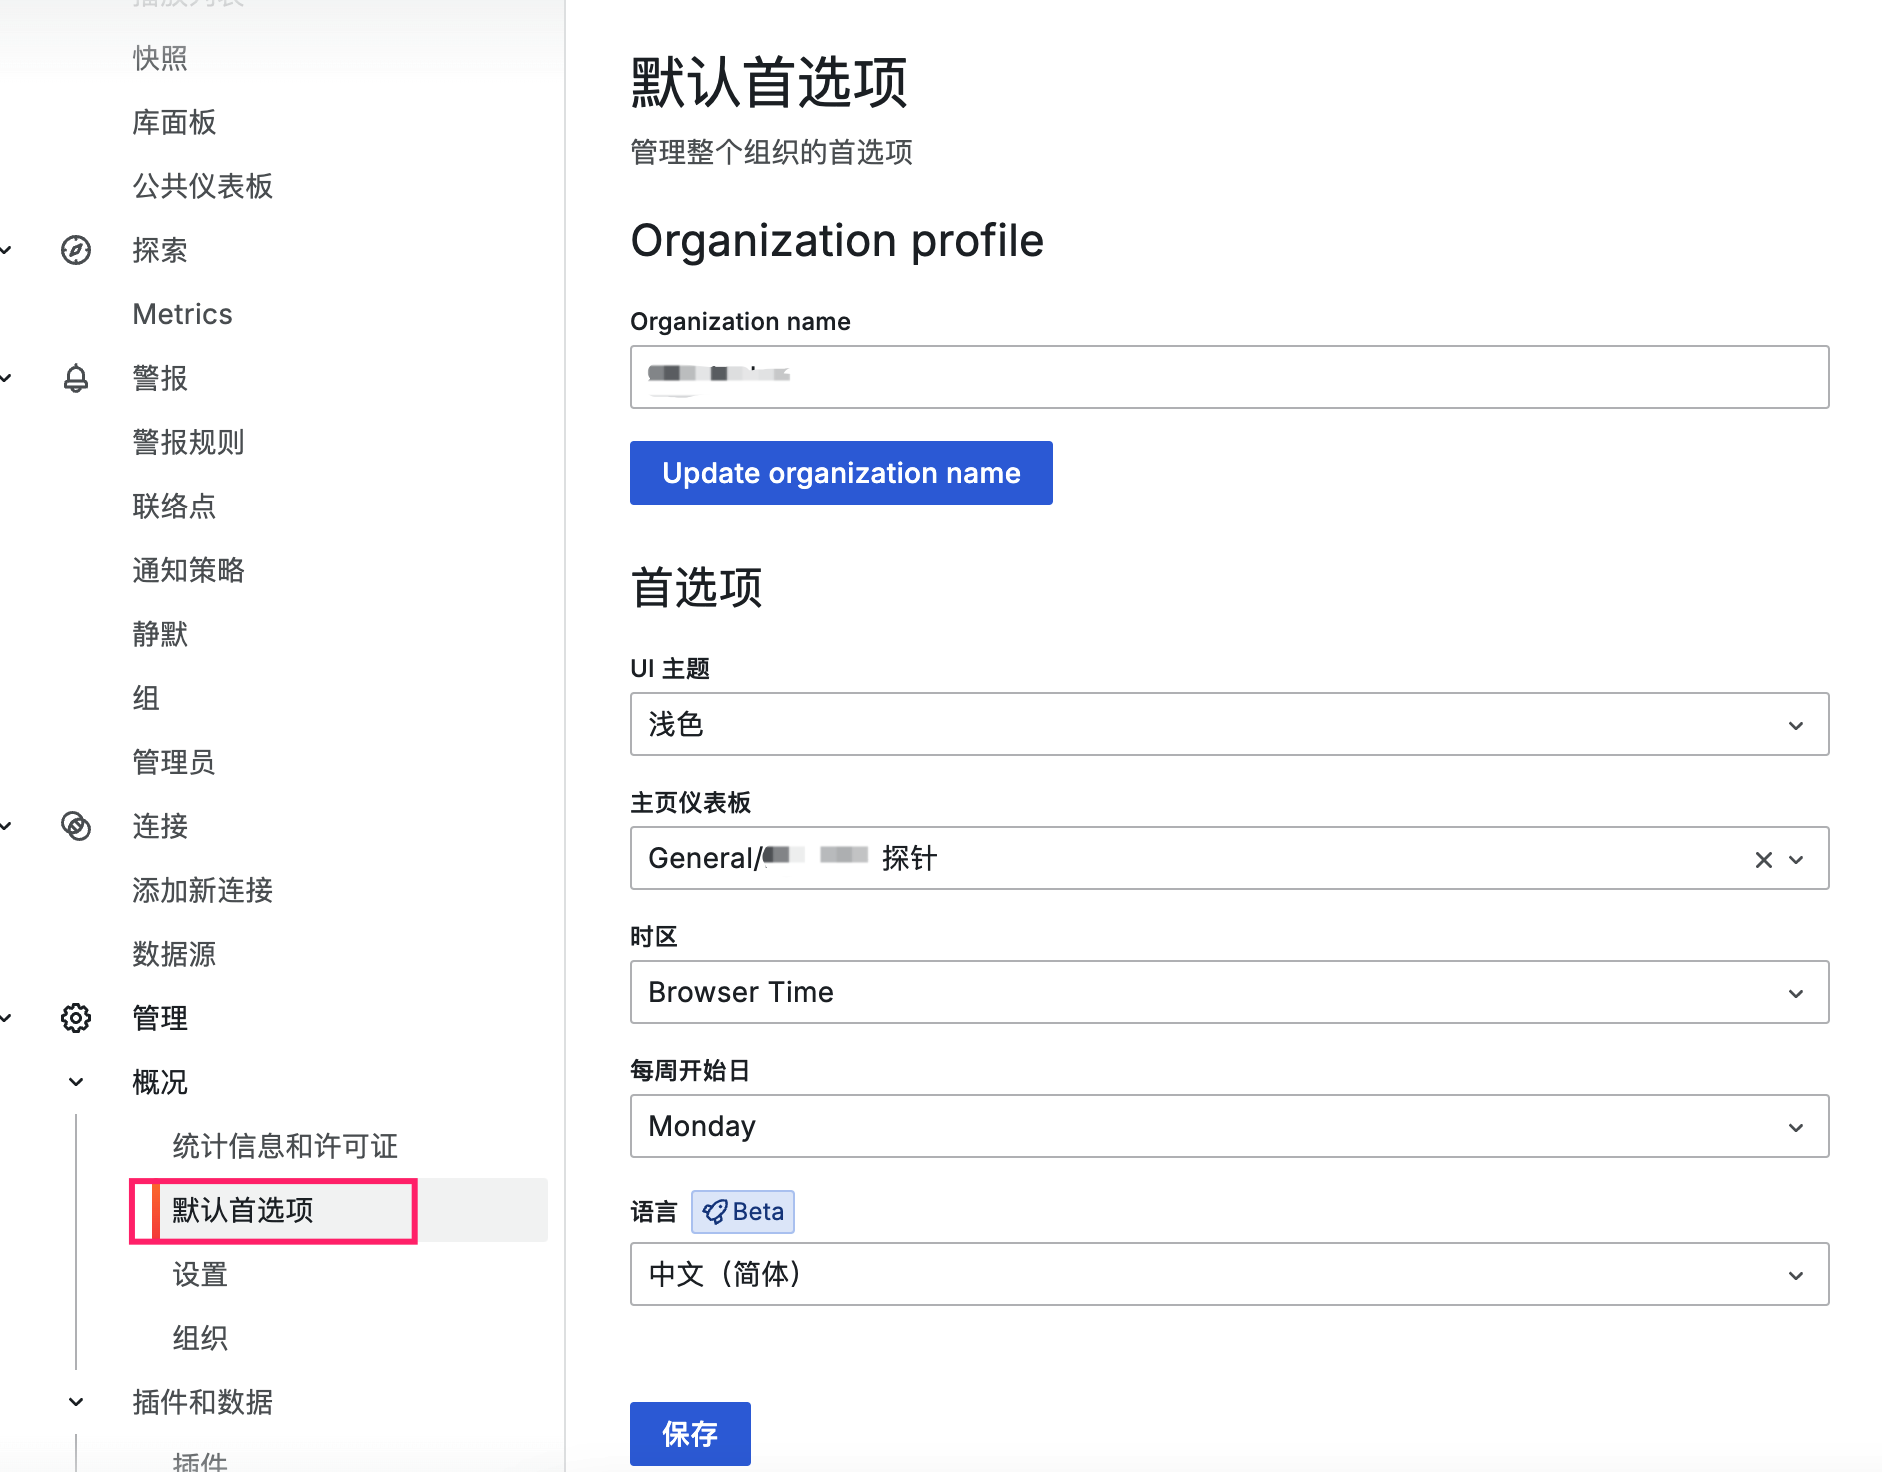
默认首选项
Organization name 与grafana.ini设置一致,否则还是会要求匿名用户登录
主页仪表盘 选择为我们配置好的探针
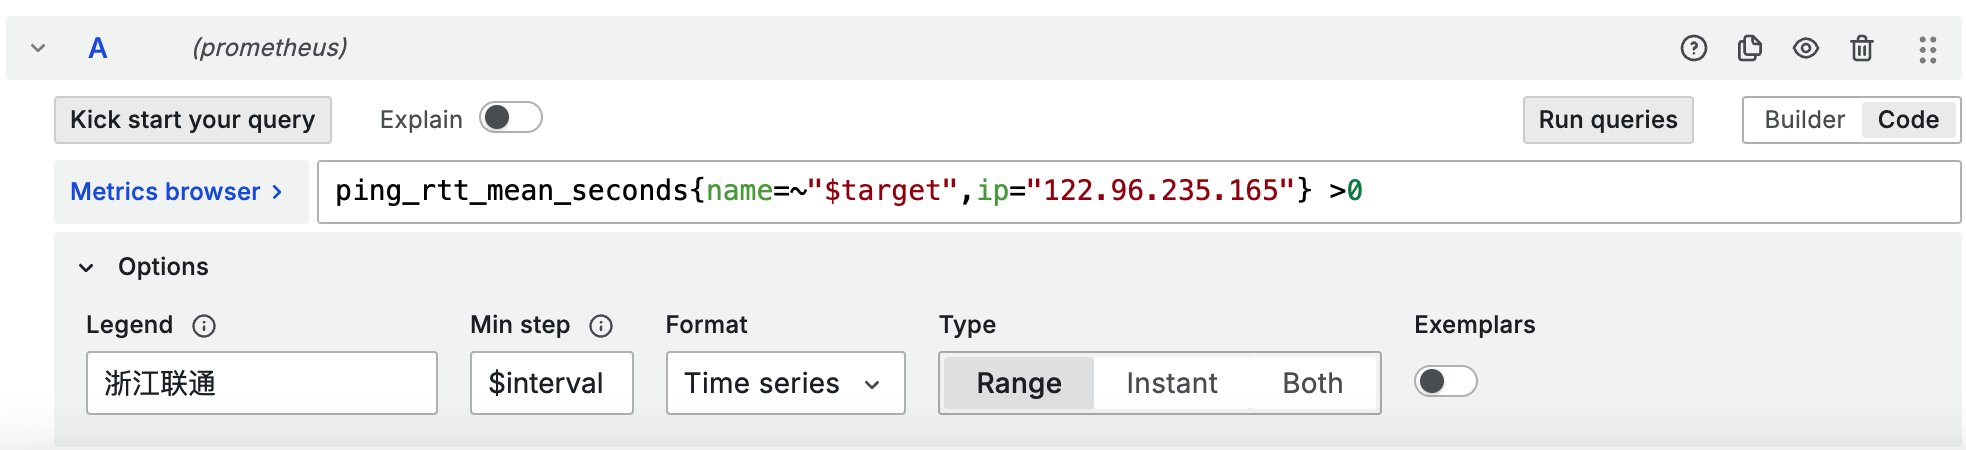
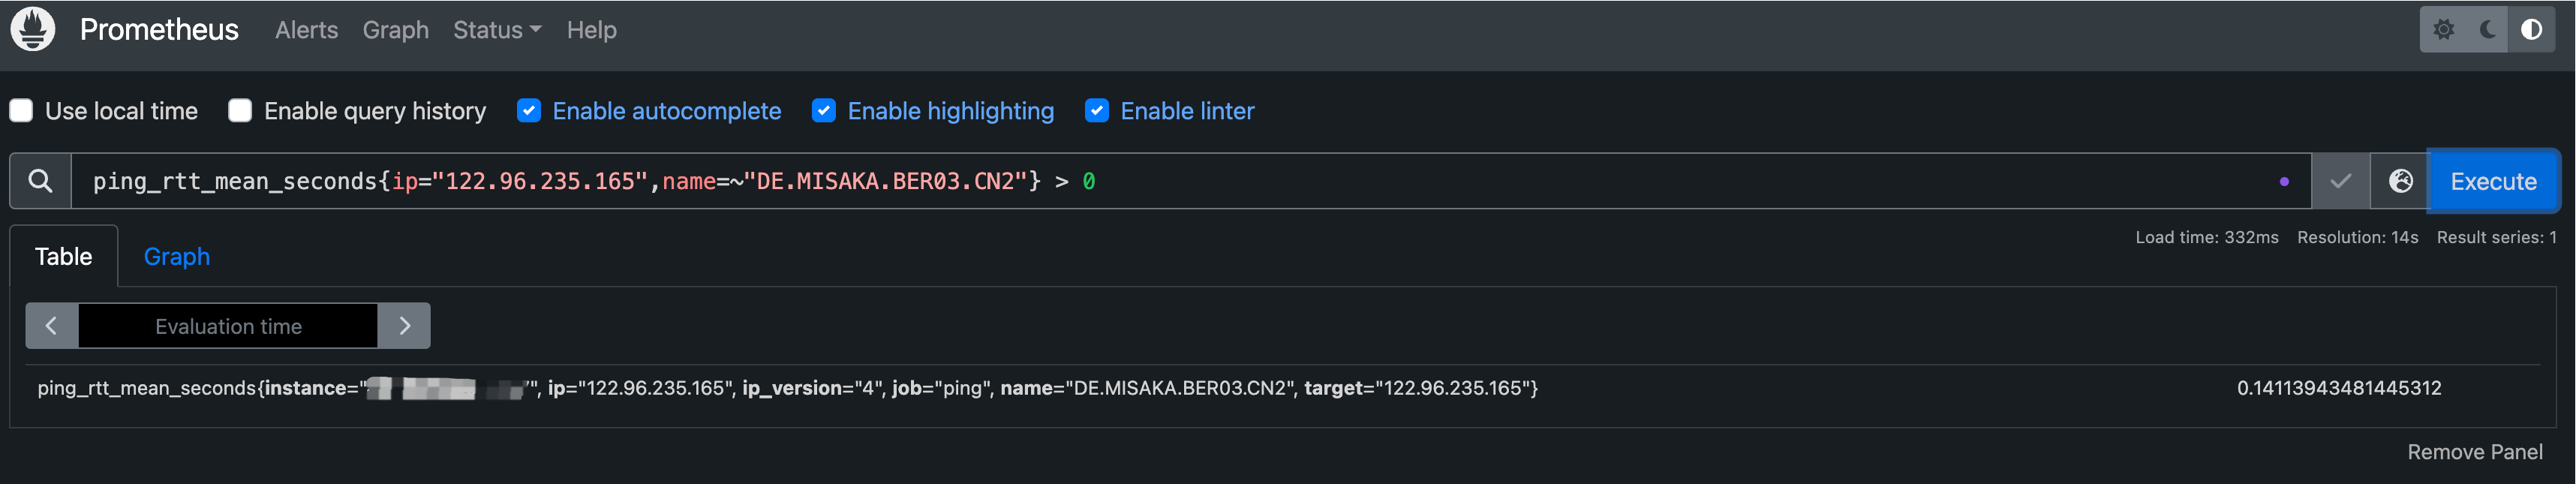
prometheus面板调试
如果正确接入了客户端,是应该可以查询到相关指标和数据的
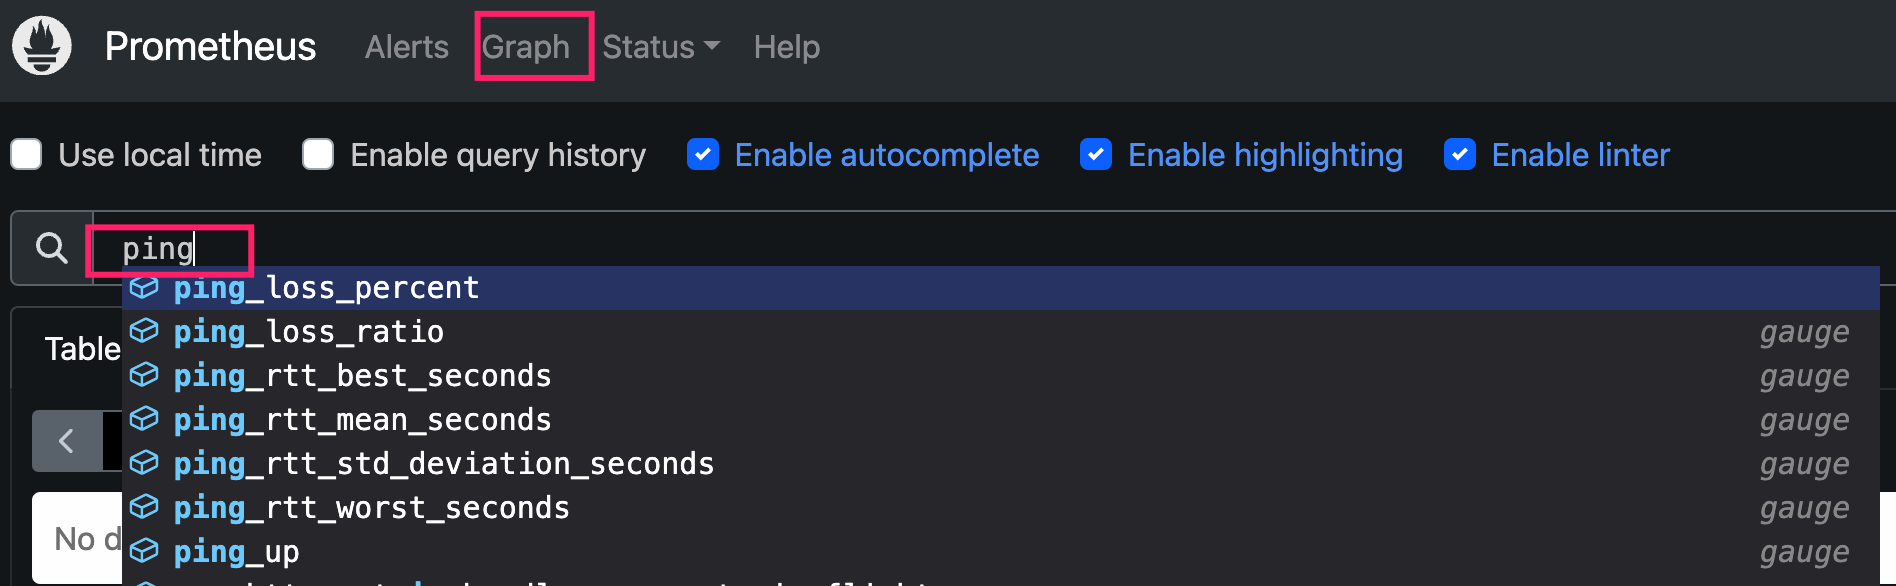
我们拿监控面板的查询指标的格式进行调试查询,可以查询到指标数据。

评论